
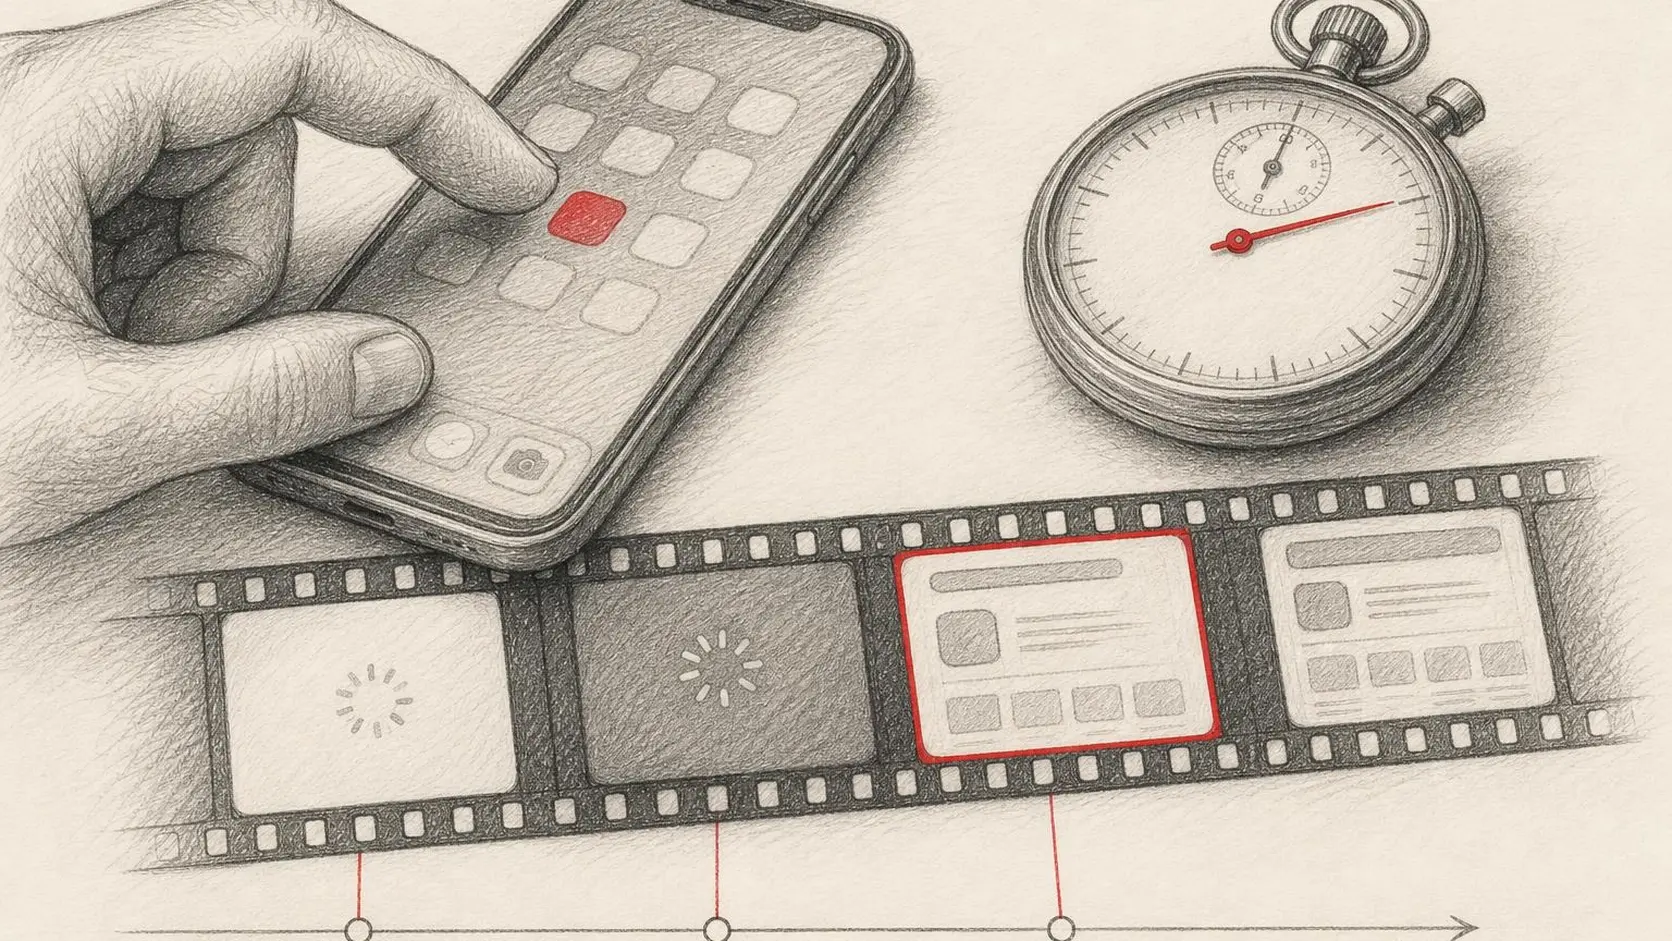
Users don't measure cold start with a stopwatch, but they feel the difference between a ready screen and a splash that seems stuck. Startup time is the first trust check: is it worth waiting for the product to get ready, or is it easier to close it and open a competitor?
In our projects, the conversation about startup speed almost always begins with "it's fast on my phone". So the first step is agreeing on what exactly we measure, on which devices and against which thresholds. Below are the metrics, targets, tools and optimisation sequence we use on Android and iOS.
Three startup moments that are easy to confuse
Measure the time from tapping the icon to three different events. These are fundamentally different moments:
- First frame (TTID, time to initial display). The system has shown the first frame of the app's UI. Android records this metric automatically, and it's what Android vitals uses.
- Ready to use (TTFD, time to full display). Primary content has loaded and the person can perform the action they came for. The system can't know this moment on its own: the app must report it via reportFullyDrawn() or, in Compose, via ReportDrawnWhen.
- Fully loaded. Secondary blocks, images and recommendations have arrived. For the user, this moment usually matters least.
A screen that's drawn quickly but doesn't respond to touch is not a fast experience. So for the product, the key metric is TTFD; TTID is a technical indicator.
Also distinguish startup types. Cold — the process is created from scratch, for example after a phone reboot. Warm — the process is alive, but the activity is recreated. Hot — the app simply returns from the background. Optimise assuming a cold start: that improves the other two as well.
Thresholds and targets
| What we measure | Threshold or target | Source |
|---|---|---|
| Cold start, Android | 5 s or longer is excessive | Android vitals |
| Warm start, Android | 2 s or longer is excessive | Android vitals |
| Hot start, Android | 1.5 s or longer is excessive | Android vitals |
| First frame, iOS | target of about 400 ms | Apple, WWDC 2019 "Optimizing App Launch" |
| Feels instantaneous | about 0.1 s | Nielsen Norman Group |
| Limit of uninterrupted attention | about 1 s | Nielsen Norman Group |
Vitals thresholds are not a goal but the floor of decency. From our experience, service and e-commerce apps should aim for a cold TTFD under 2 seconds on mid-range devices. That's a studio estimate, not a standard, and it should be calibrated against your own data and audience.
How to measure: tools
- In the lab on Android: Jetpack Macrobenchmark with StartupTimingMetric gives stable TTID and TTFD on a real device. For deep analysis, a Perfetto trace with the Android App Startups row.
- In the lab on iOS: the App Launch template in Instruments and XCTApplicationLaunchMetric in UI tests.
- In the field on Android: Android vitals in Play Console, with comparison against a peer group of similar apps.
- In the field on iOS: Xcode Organizer shows launch time by version, and MetricKit delivers aggregated metrics from users' devices.
Compare the median and the tails of the distribution — p90 and p95 — not just the average. Users on weak devices can have a completely different experience, and they're the ones most likely to abandon the app. We explained why lab testing on a flagship is misleading in our article on testing on inexpensive devices.
The method: trace, hypothesis, controlled release
In the Gmail Wear OS case study, the team analysed Perfetto traces: main thread state, time in the Runnable state (a sign of CPU contention), DEX file reading, binder transactions and JIT activity. Based on the findings, they made two groups of changes. Replacing the animated spinner with a static image and deferring the shimmer state improved startup latency by 50%. Enabling R8 rewriting of Baseline Profiles added another 20%.
What matters is not the percentage itself — on a two-core watch, removing an animation naturally has a bigger effect than on a phone — but the method: trace first, then a hypothesis, a controlled change and re-measurement. The team specifically recommends automating trace collection and validating every hypothesis with an A/B test.
The business side is well illustrated by the Lyft case from the Android Developers Blog: a 21% reduction in the drivers app's startup time came with a 5% increase in driver sessions.
First optimisation steps
- Measure a baseline. Cold TTID and TTFD on 2–3 devices of different classes, median and p90.
- Clean up Application.onCreate. Defer secondary SDK initialisation — analytics, chat, ads — until after the first screen or until first use. On Android, the App Startup library and lazy initialisation via Hilt help.
- Don't load what you don't need. The first screen should request only the data it displays. Cache the previous session's result and show it immediately.
- Get work off the main thread. Disk, network, deserialising large JSON — background only.
- Check heavy animations and layout. Animated splash, Lottie on the first screen, deep view hierarchies.
- Add Baseline Profiles for key journeys and verify the effect with Macrobenchmark. Don't forget R8 and, for profile rewriting, AGP 8.2 or newer.
- Protect the result. Add a startup benchmark to CI and compare every release with the previous one.
Typical mistakes
- Measuring only TTID and reporting success while the user stares at a skeleton for several more seconds.
- Testing a debug build: it lacks ART and R8 optimisations, so the numbers are meaningless.
- Artificially extending the splash screen "for the brand" — users perceive it as slowness.
- Relying on the average instead of p90.
- Initialising a dozen SDKs in Application.onCreate "because the docs say so".
- Optimising without re-measuring: some "improvements" have no effect at all.
Action plan
- Define the moment after which the user can actually work, and mark it with reportFullyDrawn().
- Set up Macrobenchmark or XCTApplicationLaunchMetric for cold start.
- Capture a baseline on a low-end, mid-range and flagship device.
- Check field data in Android vitals and Xcode Organizer.
- Work through the optimisation list above, one change at a time, re-measuring each.
- Add the benchmark to CI and watch for regressions.
Fast startup isn't a race for the smallest number. It's a short path to the first useful action, without the deception of skeleton screens and hidden unreadiness. We wrote about how that path fits into the overall first impression in our article on the first 60 seconds in an app, and about the business effect of speed using Zomato's experience.
Sources: Android Developers: How Gmail Wear OS improved startup; Android Developers: App startup time; Android vitals: App startup time; Apple WWDC 2019: Optimizing App Launch; Android Developers Blog: How a single Android developer improved Lyft's Drivers app startup time by 21% in one month; Nielsen Norman Group: Response Times.