

4,7B
Mobile internet users
58% of the world's population used mobile internet on their own device.
End of 2024Source: GSMA · Connectivity 2025
Mobile intelligence · 2026
We gathered figures about mobile internet, apps, Android, iOS, 5G, the mobile web, and user behavior in one place. Every number has a source and measurement period.
Research 01
4,7B
58% of the world's population used mobile internet on their own device.
4,4B
A personal smartphone remains the most important way to access mobile internet.
Research 02
67,6%
Android has the largest share of mobile operating systems in global web traffic.
106,9B
In 2025, users downloaded 106.9 billion apps and mobile games from the two main stores.
Additional signals
5,3T
In 2025, users worldwide spent 5.3 trillion hours in mobile apps.
21 GB
Average global mobile traffic per active smartphone reached 21 GB per month in 2025.
2,9B
By the end of 2025, the number of 5G subscriptions worldwide was expected to reach 2.9 billion — about one third of all mobile subscriptions.
67,4%
Chrome remains the most widely used browser on mobile and tablet devices.
$167B
In 2025, consumer spending in mobile apps reached 167 billion dollars.
38%
People live in a coverage area but still do not use mobile internet — an important challenge for inclusive design.
Journal
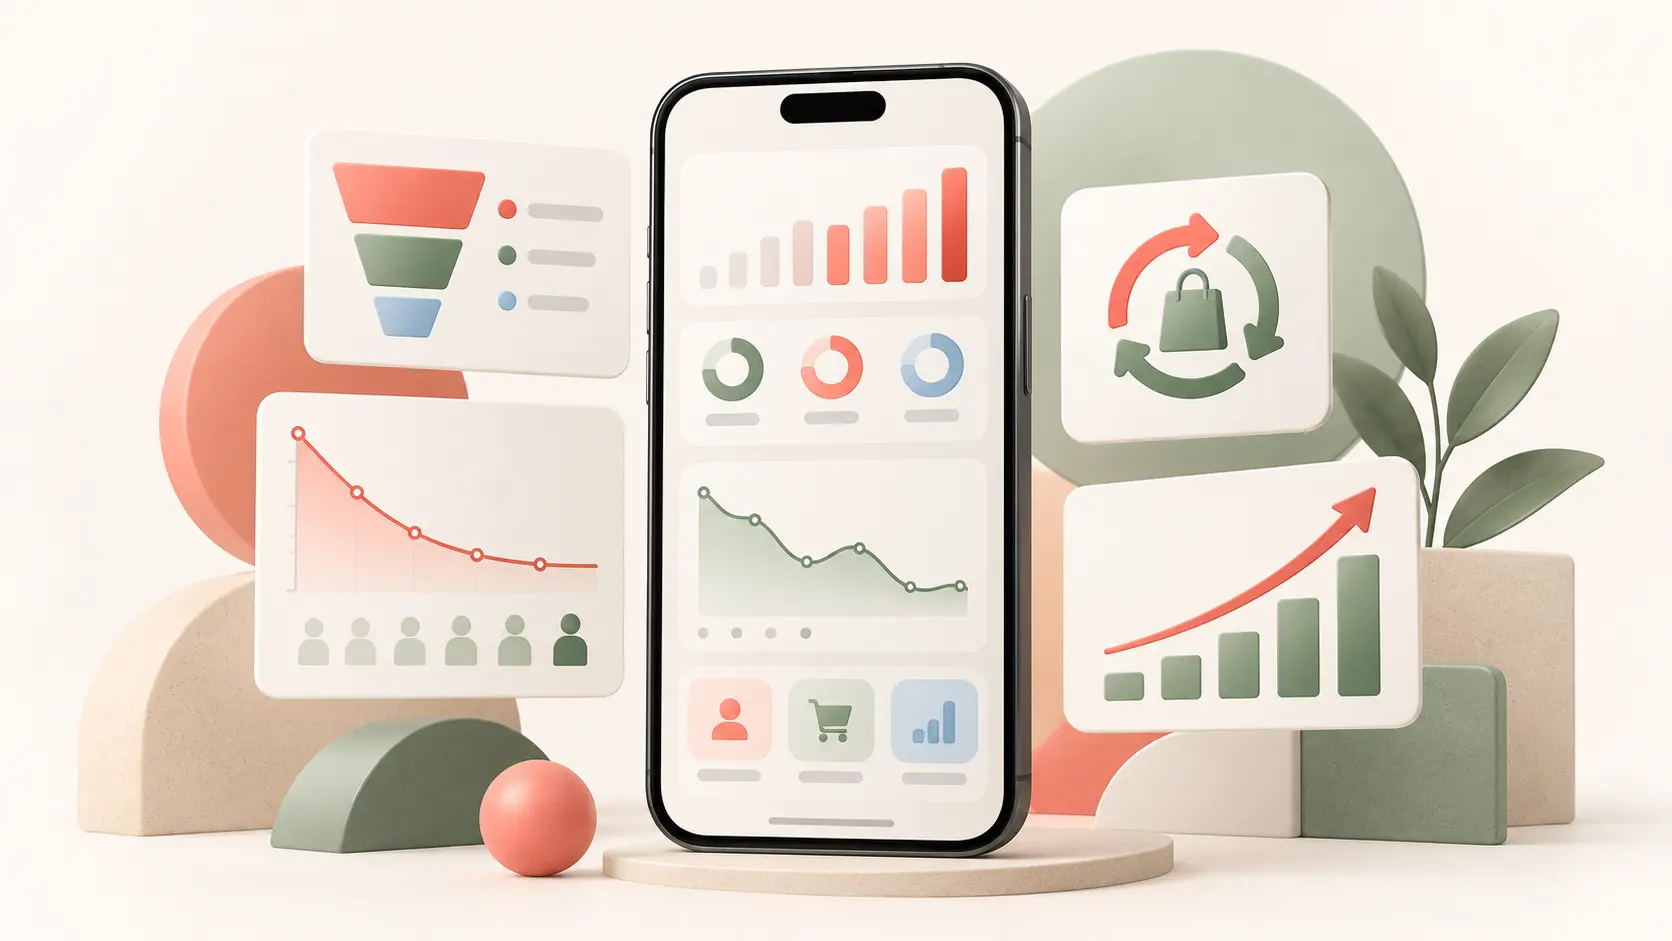
A mobile app can have many installs and still fail to deliver the return a business expects. To understand whether a product pays off, look beyond a single impressive number and follow the whole user journey: from the first open to repeat purchase and long-term use.
Payback does not always mean instant revenue after launch. For some products, it means direct income from purchases or subscriptions. For others, it means more repeat orders, lower service costs, more frequent visits, or higher customer value. Start by defining the business outcome and the period you will use to evaluate it.
Install volume shows how well reach, advertising, and the app store page are working. An install alone does not create value. Also track acquisition source, first launch rate, registration, and cost per install. If people install the app but never reach a useful first action, the issue may be positioning or onboarding.
Registration is one step closer to value, but activation should be the key milestone: the moment when a person gets a real result. For a service, it may be the first order; for a finance product, a funded account; for a B2B tool, the first task created. Compare install-to-registration and registration-to-activation conversion.
Retention shows what share of people return after a day, a week, or a month. Cohorts help separate a temporary spike from a lasting habit. Look beyond the average and compare channels, segments, and product versions. If retention drops after the first week, review the value of the repeat scenario, reminders, and overall experience.
For a commercial app, track repeat purchase rate, average order value, paid conversion, and revenue per active user. Separate new customers from returning customers. A repeat purchase often reveals real product value more clearly than a one-time transaction.
CAC is the cost of acquiring one customer. LTV is the expected value of that customer over the full relationship. A practical rule is that LTV should exceed CAC by enough to cover operations, risk, and product development. Calculate these metrics by channel and cohort so an expensive acquisition source cannot hide inside an overall average.
Start with one primary metric tied to the business outcome and three or four supporting metrics. For example: activation, day-30 retention, repeat purchase, and revenue per user. Define the events, data sources, and review cadence. Metrics should support decisions: what to change in the product, which channel to scale, and where another experiment is needed.
You can see whether a mobile app pays off when marketing spend, user behavior, and revenue are connected in one clear model. Installs show scale, registration and activation show first value, retention shows habit strength, repeat purchases show the quality of the offer, and LTV-to-CAC shows the economics of growth.