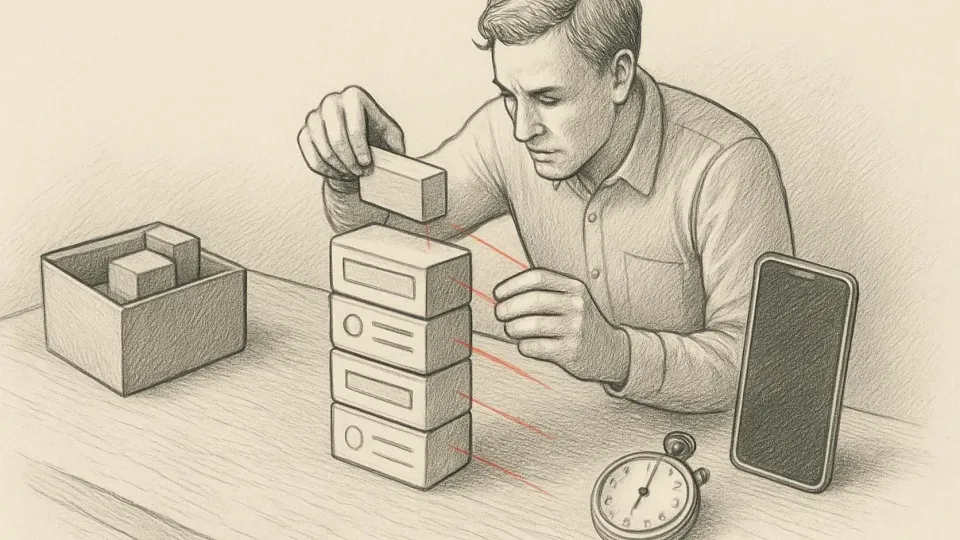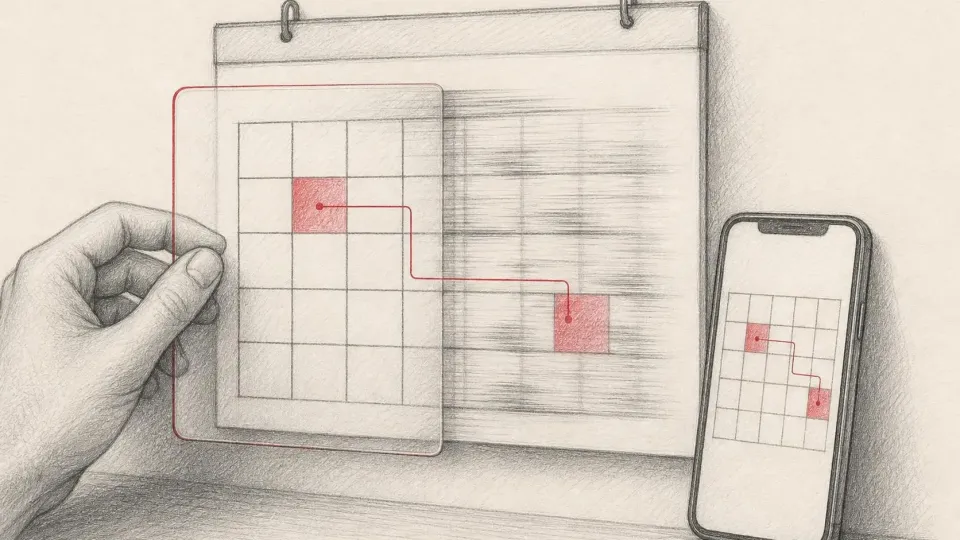
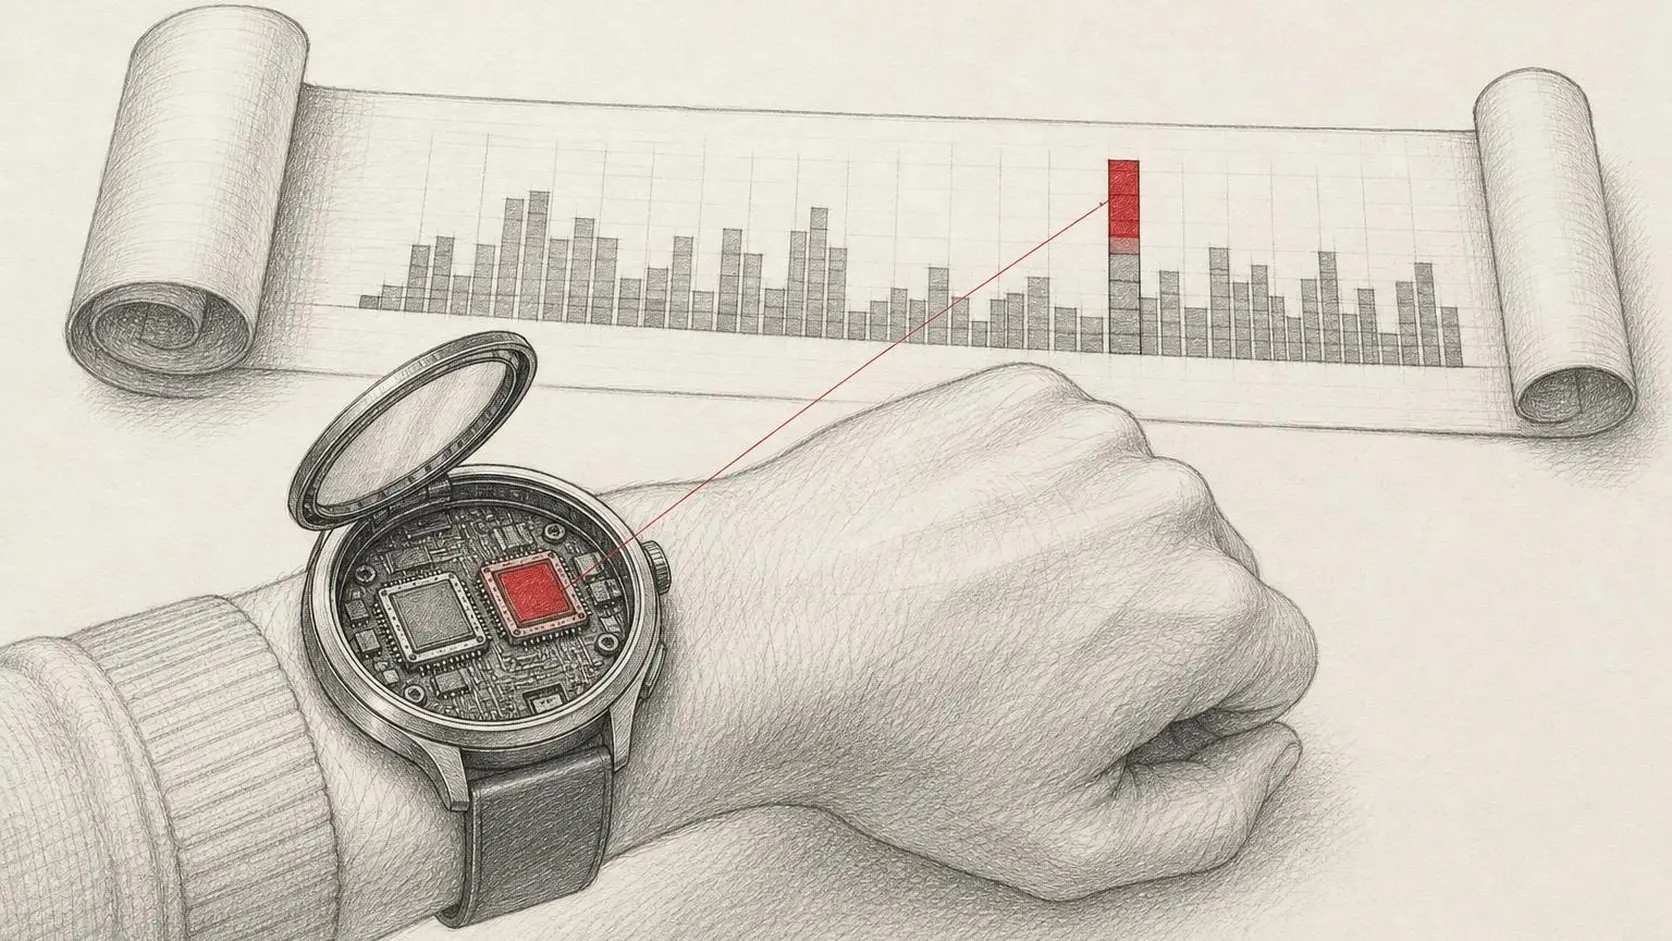
The small screen and limited resources of a wearable make every delay noticeable: a person raises their wrist for a few seconds, and if the app hasn't shown the mail by then, the moment is gone. The Gmail Wear OS case study published on Android Developers shows how a methodical startup analysis helps uncover non-obvious causes of a slow first screen.
The case is valuable less for its result than for the transparency of its method: the team shows step by step where to look in a trace and how to interpret what you see. We use the same analysis sequence in our own Android projects, so below is a breakdown of the case with practical commentary.
Context: why a watch is a tough test
The Gmail Wear OS team had its own performance criteria for startup and rendering and worked to meet them. An important detail the case highlights: the device had only two CPU cores. On such hardware, any parallel work — animation, background initialisation, system processes — competes with the main thread far more noticeably than on a modern eight-core phone.
The authors note that even if you have no formal thresholds, there's almost always room to improve startup if you take time to investigate. For a first assessment, you can compare your app against a peer group in Play Console and simply trust your instincts: if startup feels slow, it is.
How they found the problem: five points in the trace
The team recorded a system trace and analysed it in Perfetto, because it shows what's happening across the whole device, not just in your process. Here's what they looked at and what it means.
| What to look at in the trace | What it signals | What to do |
|---|---|---|
| The Android App Startups row | startup boundaries up to the first frame (TTID) | pin it to the top and analyse everything in that interval |
| Runnable vs Running ratio on the main thread | the thread is ready to work but doesn't get the CPU — contention | look for intensive parallel work, especially animations |
| OpenDexFilesFromOat* | time spent reading the app's DEX files | reduce code size with R8 minification |
| Binder transactions | system service calls that may block startup | defer non-essential calls until after startup |
| Jit thread pool | code is compiled on the fly instead of ahead of time | extend the Baseline Profile to the point the screen is ready |
Main thread and CPU contention
After selecting the startup interval on the main thread, the team examined the Thread States panel. The more time the thread spends in Runnable relative to Running, the more likely there's CPU contention: the thread is ready to run, but the scheduler gives the core to something else. The visible app has the highest priority, so an idle main thread often means it's being "interrupted" by intensive work inside the app itself — for example, animation rendering.
Binder transactions
The first binder transaction turned out to be long. Following the reply to the system process, the team saw a Runnable (Preempted) state and display controller events with higher priority. The conclusion: this was important system work — putting frames on the screen — and they left it as is. We consider this one of the most useful episodes in the case: not every finding in a trace needs fixing, and knowing when to stop saves days of work.
JIT activity
The app already had a Baseline Profile, so JIT barely ran before the first frame. But right after it, noticeable background compilation appeared. The fix was to extend profile collection: in the Macrobenchmark generation test, wait for a specific element that indicates the screen is fully populated.
What worked
- A static state instead of a spinner. Having noticed CPU contention, the team replaced the animated loading indicator with a single static image.
- Deferred shimmer. The splash screen was prolonged to defer shimmer — the second loading state — and free up CPU resources.
- R8 rewriting of Baseline Profiles. Based on the OpenDexFilesFromOat* and JIT analysis, the team enabled profile rewriting via R8, which requires AGP 8.2 or newer.
- A process, not a one-off. The team recommends setting up automated collection of traces and results through benchmarking.
As a result, the first group of changes — the static image and deferred shimmer — improved startup latency by 50%, and R8 rewriting by another 20%. These aren't universal percentages for every product, but they're a good example of engineering discipline: measure, find the bottleneck, change one cause and measure again. We examined how animation in general affects speed and perception in our article on animation in mobile interfaces.
How to repeat the analysis in your project
- Build a release-like variant: a debug build disables ART optimisations and the trace won't be representative.
- Record a cold-start trace on the weakest target device — via on-device system tracing or Macrobenchmark.
- Open the trace in Perfetto, pin Android App Startups and the two main-thread rows.
- Assess Runnable/Running. If Runnable is significant, look for animations and parallel tasks in that interval.
- Check OpenDexFilesFromOat*, binder transactions and the Jit thread pool using the table above.
- Form one hypothesis, make one change, re-measure on the same device.
- Validate the result with an A/B test or controlled release, and reject the change if it had no effect.
Typical mistakes in this kind of analysis
- Adding loading indicators when you don't know what to optimise: they mask the problem and consume resources themselves.
- Fixing everything that looks suspicious instead of starting with the longest frame.
- Ignoring hardware context: on a two-core device, high Runnable time is partly expected.
- Ending Baseline Profile collection at the first frame.
- Judging impact on a single launch instead of a series of measurements.
Checklist
- There's a reproducible way to record a cold-start trace.
- Five points are checked: startup boundaries, Runnable/Running, DEX, binder, JIT.
- Startup animations are replaced with static states where they compete with the first screen.
- The Baseline Profile covers the journey until the screen is fully ready; R8 rewriting is enabled.
- Every change is validated by re-measurement and an A/B test.
- Trace collection is automated in CI.
Teams often add loading indicators when they don't know what to optimise. This case is a reminder that sometimes the best animation is the one you don't have to run. We described the broader framework of startup metrics in our article on app startup speed, and the role of Baseline Profiles in another example in our breakdown of the Android Calendar case.
Sources: Android Developers: How Gmail Wear OS improved app startup; Android Developers: App startup time; Android Developers: Baseline Profiles overview; Perfetto documentation.